Chrome 开发者工具 (Chrome DevTools) 堪称现代网页开发和调试的“瑞士军刀”,无论是网页开发者、测试人员,掌握它都是必须的。
如何打开开发者工具?
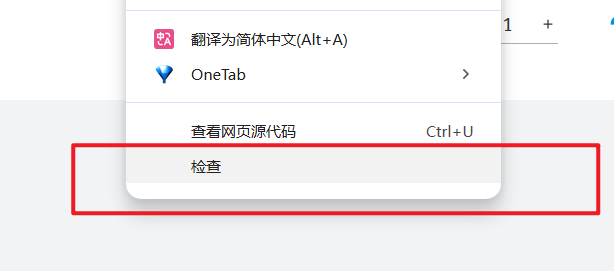
- 右键检查:在页面任意位置点击鼠标右键,选择“检查”(Inspect)。
- 快捷键:Windows/Linux:
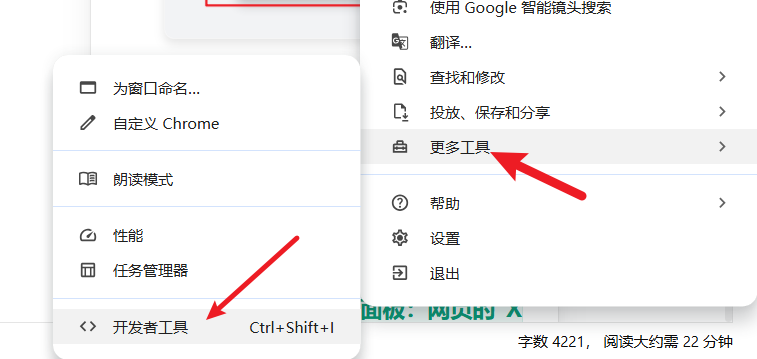
F12或Ctrl+Shift+I;macOS:Cmd+Opt+I。 - 浏览器菜单:点击浏览器右上角的三个点菜单 -> 更多工具 -> 开发者工具。
第一部分:核心面板入门
一、元素 (Elements) 面板:网页的“X光透视仪”
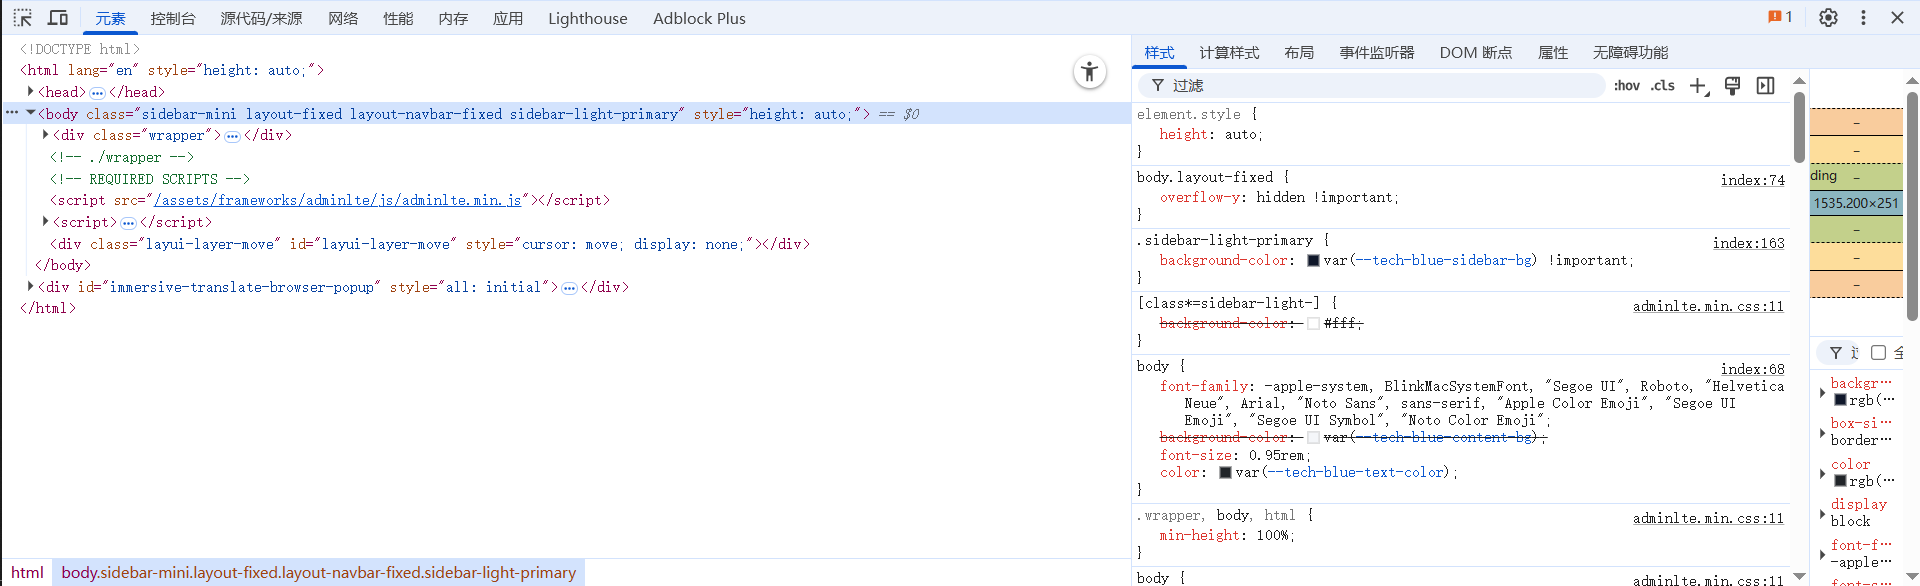
一句话概括: 实时查看和编辑页面的 HTML 结构与 CSS 样式。
这里是您与页面视觉元素的直接交互界面。左侧是动态生成的 HTML DOM 树,右侧是对应元素的 CSS 样式窗格。您可以实时编辑任何 HTML 或 CSS,并立即在页面上看到修改效果(刷新后失效),非常适合快速验证布局和样式调整。
二、控制台 (Console) 面板:与页面对话的窗口
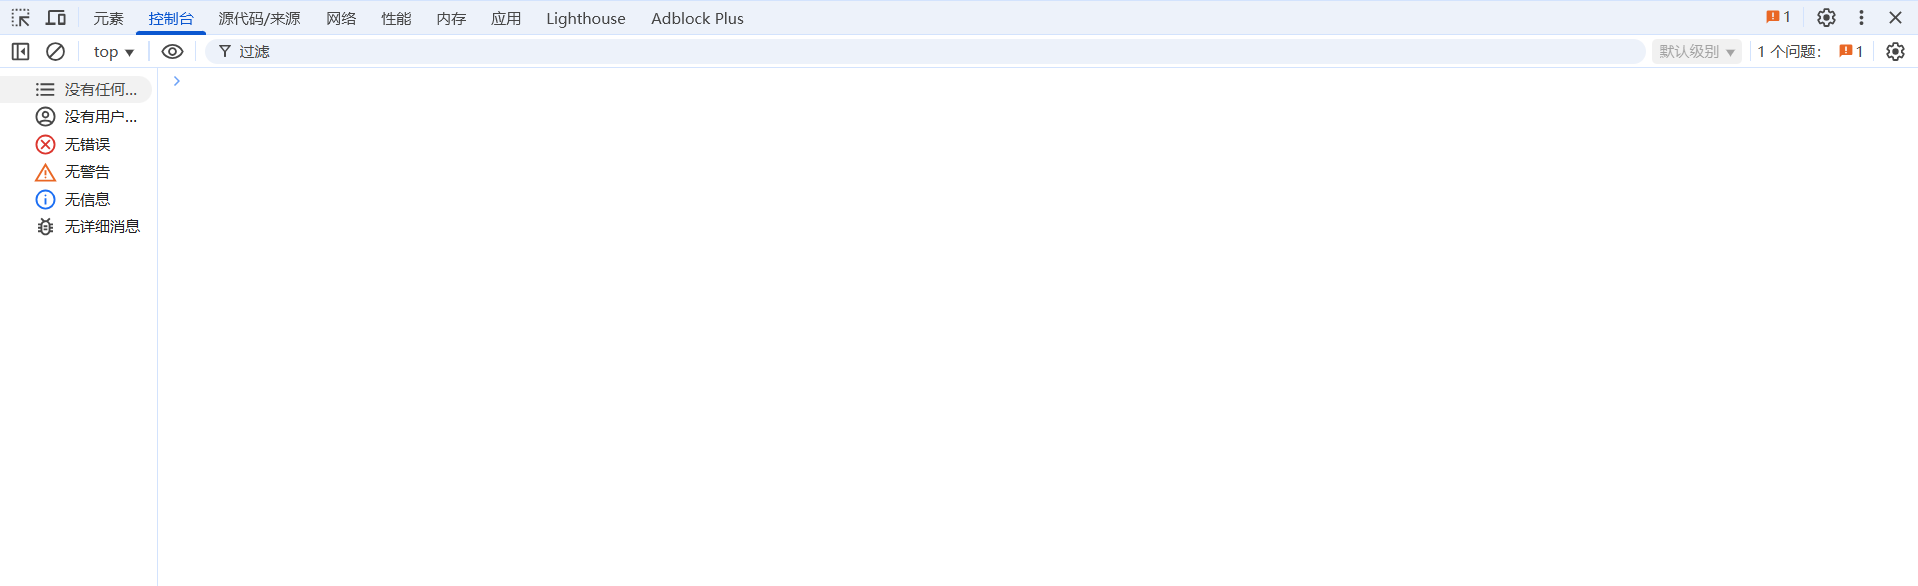
一句话概括: 查看日志信息和执行 JavaScript 代码的交互式命令行。
这里是您诊断 JavaScript 问题的首选之地。所有 console.log 的输出、代码运行的警告(黄色)和致命错误(红色)都会在这里显示。同时,它也是一个功能完备的 JavaScript 运行环境 (REPL),您可以在此执行代码、查询变量、直接操作页面元素。
三、网络 (Network) 面板:网页加载的“监控录像”
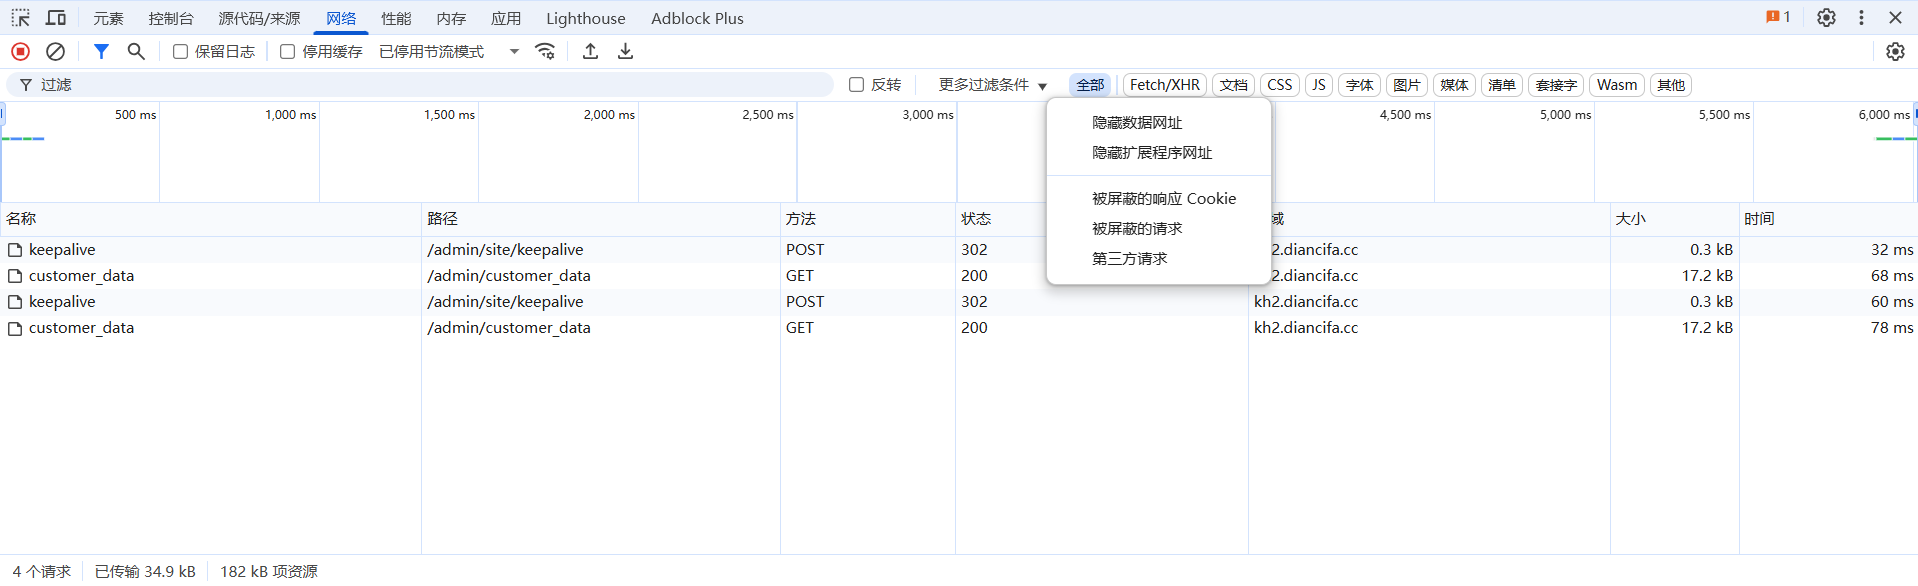
一句话概括: 监视页面加载过程中所有的网络请求和响应,是性能分析和接口调试的神器。
它记录了页面加载的所有资源,包括 HTML、CSS、JS、图片以及与服务器交互的 API 请求 (Fetch/XHR)。您可以筛选请求、查看状态码(如 200 成功,404 未找到)、检查请求头和响应体。
- 进阶:显示预检请求 在处理复杂的跨域 (CORS) 请求时,浏览器会先发送一个
OPTIONS方法的“预检请求”。DevTools 默认隐藏它。要查看它,请点击网络面板右上角的 设置 图标 (⚙️),并勾选 “显示预检请求” (ShowOPTIONSpreflight requests)。这对于调试跨域问题至关重要。
四、应用 (Application) 面板:浏览器的“本地仓库”
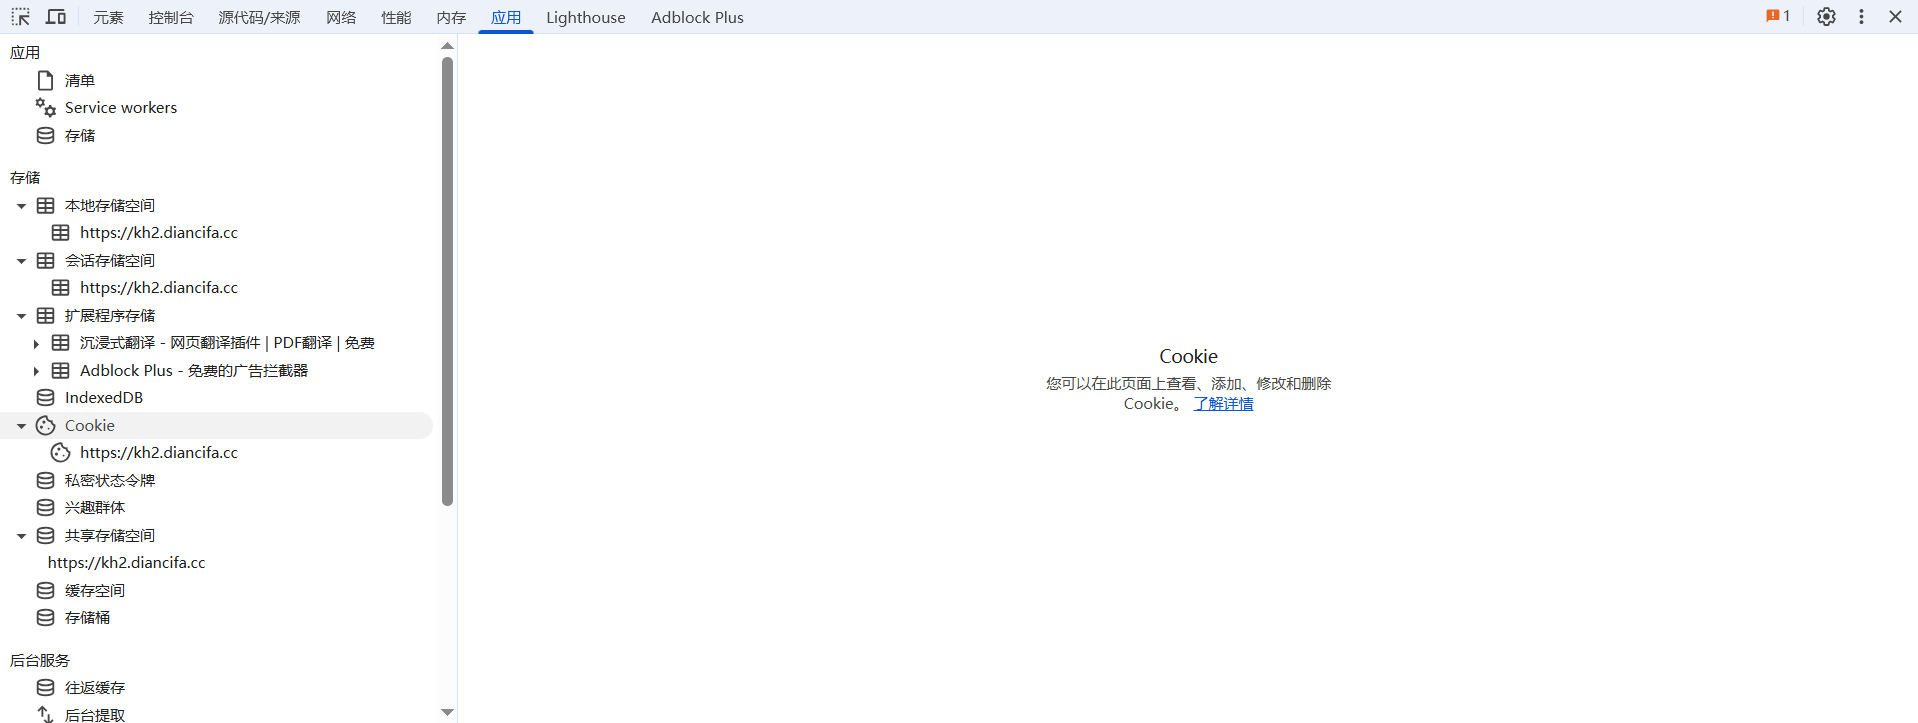
一句话概括: 查看和管理浏览器为网站存储的所有本地数据。
这里管理着网站在您电脑上存储的信息,如 Local Storage (永久存储)、Session Storage (会话存储) 和 Cookie (常用于维持登录状态)。您可以在此查看、编辑甚至清除这些数据,非常适合调试与本地存储相关的功能。
第二部分:高级调试与性能分析
现在,让我们进入更强大的两个面板:源代码和性能。
五、源代码 (Sources) 面板:JavaScript 的“手术室”
一句话概括: 这是 JavaScript 的终极调试中心,您可以在此设置断点、单步执行代码、检查变量,以及替换线上文件。
“源代码”面板主要由三个部分组成:
- 文件导航器 (左侧):显示页面加载的所有资源,您可以找到任何一个 JS 或 CSS 文件。
- 代码编辑器 (中间):显示您所选文件的内容。
- 调试器窗格 (右侧):包含所有调试工具,如断点、调用堆栈、作用域变量等。
核心功能1:断点与代码执行控制
当您在代码中设置了断点(通过点击行号)或触发了事件断点后,代码执行到该处会暂停,页面顶部会出现如图所示的控制条: 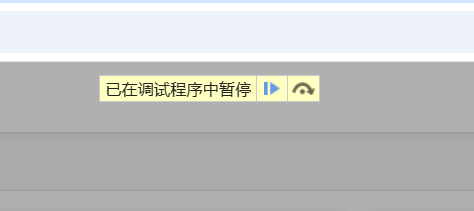
同时 源代码面板 右侧会出现如图控制按钮
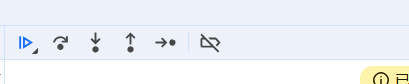
这条控制栏是您指挥代码执行的遥控器。让我们逐一解析每个按钮的含义和使用场景:
| 图标 | 名称 (官方) | 快捷键 | 含义和使用场景 |
|---|---|---|---|
| ▶ | 恢复脚本执行 (Resume) | F8 | 含义:让程序继续执行,直到遇到下一个断点或程序结束。 场景:您已经看完了当前断点的信息,想让程序继续跑下去。 |
| ↪ | 跳过下一个函数调用 (Step over) | F10 | 含义:执行当前行的代码,如果当前行是一个函数调用,它会执行完整个函数,然后停在下一行。它不会进入函数内部。 场景:这是最常用的单步调试操作。您确定当前行的函数没有问题,只想看它执行后的结果,不想陷入函数内部的细节。 |
| ⇩ | 进入下一个函数调用 (Step into) | F11 | 含义:如果当前行是一个函数调用,此操作会进入该函数的内部,停在函数体的第一行。 场景:您怀疑当前行的这个函数有问题,或者想了解它的具体实现,需要进入函数内部一探究竟。 |
| ⇧ | 跳出当前函数 (Step out) | Shift+F11 | 含义:执行完当前所在函数的剩余部分,然后停在调用这个函数的那一行代码的下一行。 场景:您通过“Step into”进入了一个函数,看了几行后发现没问题,不想再一行行地走完,想快速返回到调用它的地方。 |
| ↷ | 单步执行 (Step) | F9 | 含义:与“Step over”类似,但更细粒度。当涉及 async/await 等异步操作时,“Step”会进入异步代码的内部,而“Step over”通常会跳过。对于同步代码,两者行为相似。场景:需要调试 async 函数的底层细节时使用。 |
核心功能2:本地替换 (Local Overrides)
这是“源代码”面板的“核武器”。它允许您用本地修改过的文件去替换线上网站正在加载的 JS 或 CSS。
- 在“源代码”面板的“替换 (Overrides)”子标签页中,选择一个本地文件夹并授权。
- 在“网络”面板中,右键点击您想修改的文件,选择“替换内容 (Override content)”。
- DevTools 会在“源代码”面板打开该文件的本地副本。
- 修改并保存。刷新页面后,浏览器将加载您本地的版本。这对于调试生产环境的 Bug 极其高效。
六、性能 (Performance) 面板:应用的“心电图仪”
一句话概括: 通过录制和分析,找到导致页面卡顿、掉帧的性能瓶颈。
这个面板看起来复杂,但核心思想很简单:录制一段时间内的页面活动,然后分析报告。
如何使用:
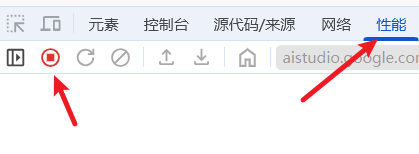
- 打开 “性能 (Performance)” 面板。
- 点击 录制按钮 (⚫) 或按
Ctrl+E/Cmd+E开始录制。 - 在页面上执行您想要分析的操作(例如,滚动页面、点击一个复杂动画的按钮)。
- 再次点击录制按钮停止录制。
如何分析报告:
录制结束后,您会看到一份详细的报告,主要关注以下几个部分:
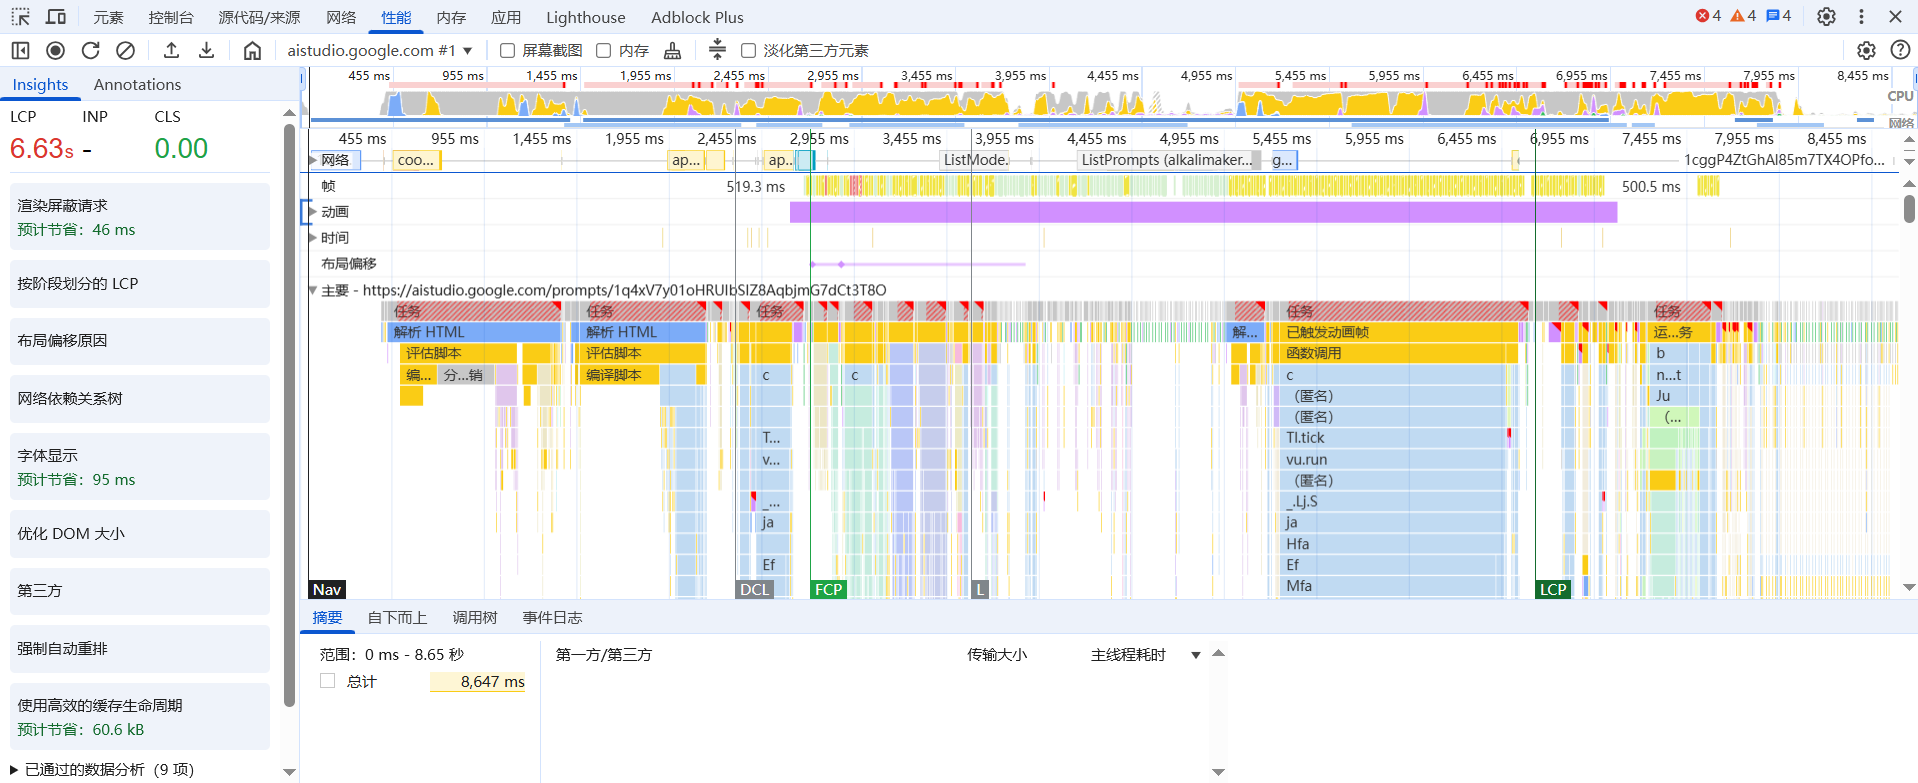
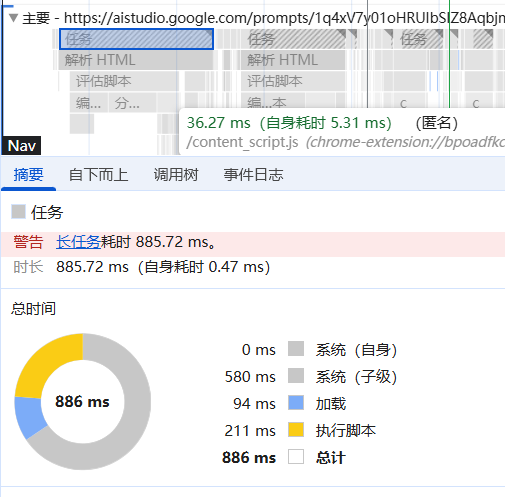
针对该火焰图,具体分析在文本底部。
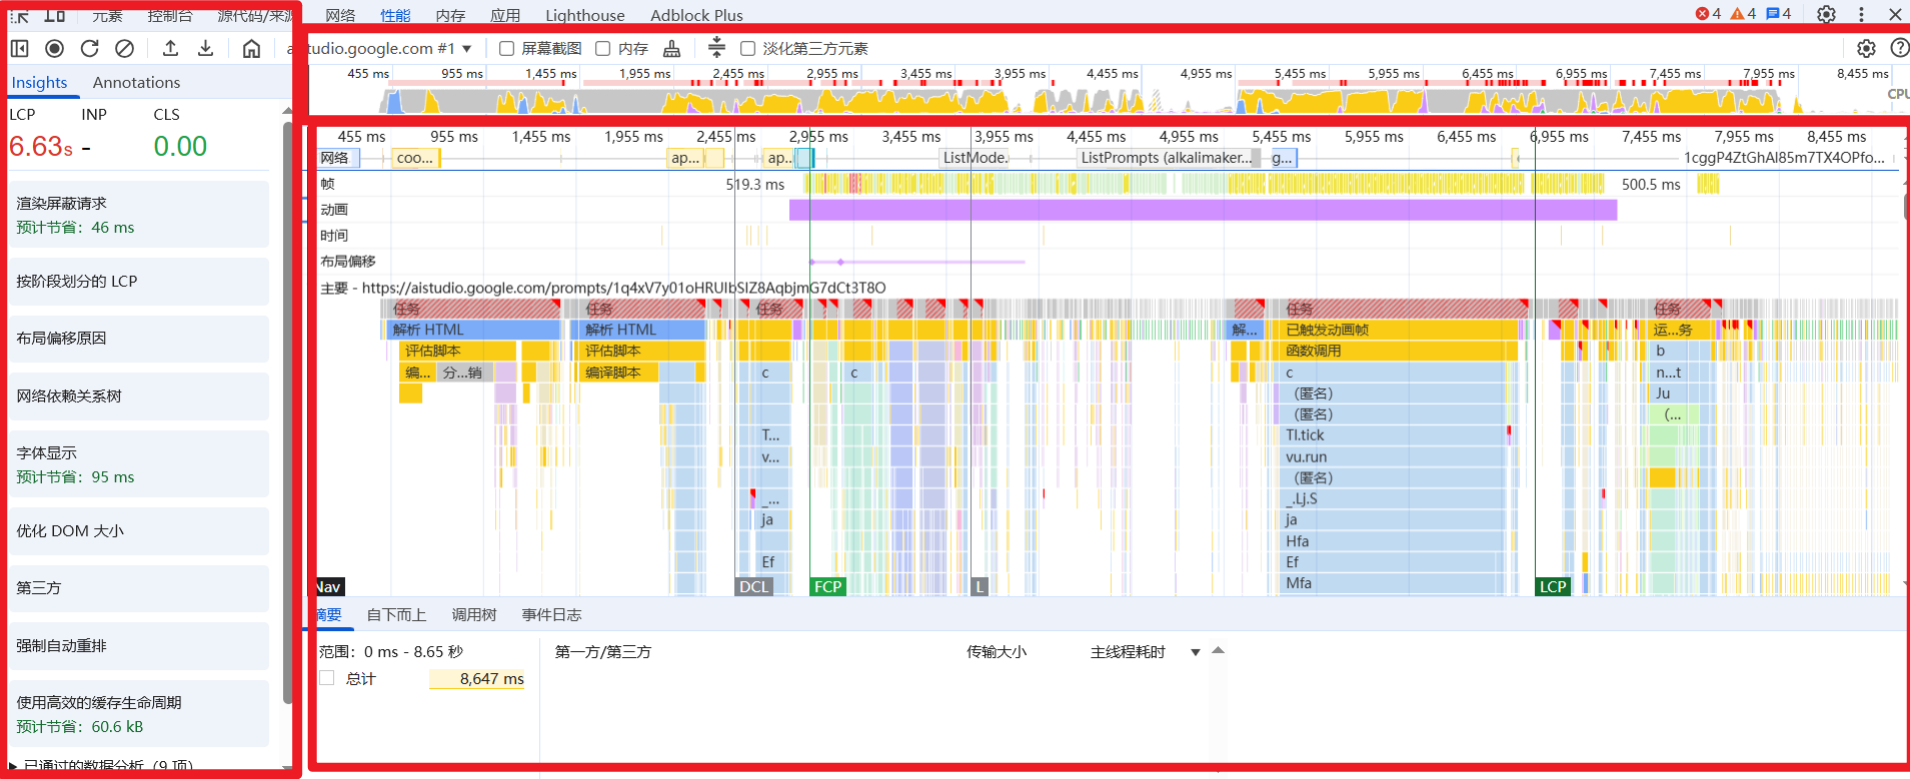
- 概览 (Overview):顶部的时间轴图,显示了 CPU 使用率、FPS (每秒帧数) 等宏观指标。如果看到 红色长条,说明有长时间运行的任务,很可能是卡顿的元凶。
- 主线程火焰图 (Main):这是最重要的分析区域。
- 它是一个火焰图 (Flame Chart),X 轴代表时间,Y 轴代表调用堆栈(上面的函数是被下面的函数调用的)。
- 寻找宽的、黄色的块:黄色代表 脚本执行 (Scripting)。一个很宽的黄色块意味着一个 JS 函数执行了很长时间,这就是需要优化的目标。
- 寻找宽的、紫色的块:紫色代表 渲染和布局 (Rendering & Painting)。过宽的紫色块可能意味着“强制同步布局”或“布局抖动”(Layout Thrashing),这是常见的性能杀手。
- 摘要 (Summary):当您在火焰图中选中一个任务时,摘要选项卡会以饼图和列表的形式,展示该任务中各项活动(如脚本、渲染、绘制)所花费的时间,帮助您快速定位耗时最多的部分。
常用场景:
- “为什么页面滚动起来一卡一卡的?”(录制滚动过程,检查火焰图中是否有长任务阻塞了主线程)
- “点击这个按钮后,页面为什么会‘冻结’一下?”(录制点击操作,找到那个执行时间过长的 JS 函数)
附火焰图分析
它看起来非常复杂,像一堆杂乱的彩色条块,但请别担心。一旦您理解了它的阅读规则,它就会变成一个能清晰讲述“您的网页是如何变慢的”故事的强大工具。
让我们把它彻底分解,让您从“完全看不懂”到“能从中找出问题”。
一、 这张图是什么?—— 网页的“施工录像”
首先,把它想象成一个高精度、逐帧的录像,记录了浏览器从打开您的网页到加载完成的整个“施工过程”。这个过程中的每一步——下载文件、运行代码、绘制像素——都被记录了下来。
我们的目标,就是从这个录像中,找到那些磨洋工的工人 或者 设计不合理的施工步骤,也就是性能瓶颈。
二、 解读图表:从上到下,从左到右
我们将这张图分为三个主要区域来解读:顶部概览、中部主线程火焰图、左侧智能分析 (Insights)。
1. 顶部概览:宏观时间轴
这部分是整个录制过程的缩影。
- CPU 图表:那条黄、紫、绿色的起伏图表显示了 CPU 的繁忙程度。高峰意味着 CPU 在拼命工作。
- 网络 (Network) 轨道:显示了网络请求的时间线。每一条横杠代表一个被下载的文件。条越长,下载时间越久。
- 时间刻度:
455 ms,955 ms... 这是从页面加载开始计算的时间。 - 关键指标标记:
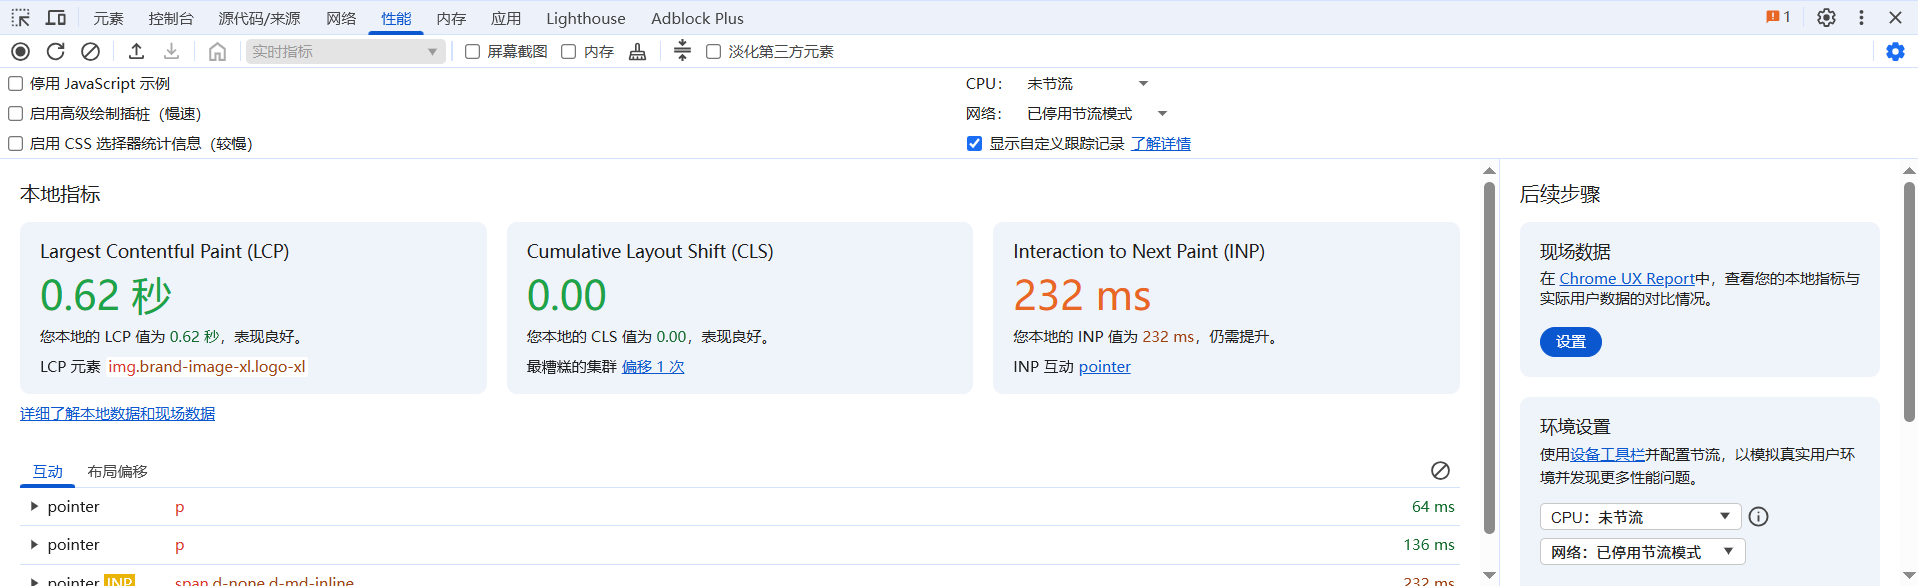
FCP(First Contentful Paint):首次内容绘制。浏览器第一次在屏幕上画出“有意义”的东西(如文字或图片)的时间点。LCP(Largest Contentful Paint):最大内容绘制。视口中最大的图片或文本块被渲染出来的时间点。这是衡量用户感知加载速度的核心指标。在您的截图中,LCP 高达 6.63秒,这是一个非常需要优化的信号(理想值应在 2.5 秒内)。DCL(DOMContentLoaded):HTML 文档被完全加载和解析完成的时间点,不包括样式表、图像等。L(Load):页面所有资源(包括图片、CSS等)都加载完成的时间点。
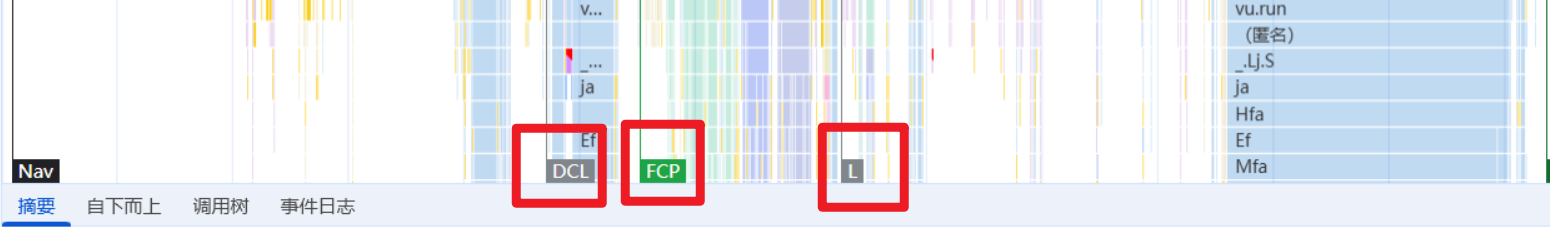
小结:仅从顶部看,我们就知道这个页面加载了超过8秒,并且用户要等 6.63 秒才能看到主要内容,体验很差。
2. 中部主线程火焰图:性能问题的核心
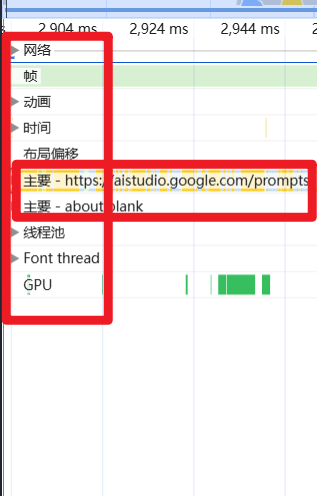
这是最重要的部分,也是最复杂的部分。
阅读法则:
- X轴(从左到右):代表 时间。
- Y轴(从上到下):代表 调用堆栈 (Call Stack)。这是一个核心概念:在上面的任务,是被它正下方的任务调用的。
颜色密码:
- 黄色 (Scripting):执行 JavaScript 代码。这是最需要关注的颜色。
- 紫色 (Rendering & Layout):计算样式和布局。浏览器在计算每个元素应该在什么位置、是什么样子。
- 蓝色 (Parsing HTML):解析 HTML。
- 绿色 (Painting):绘制。浏览器把计算好的元素实际画到屏幕上的过程。
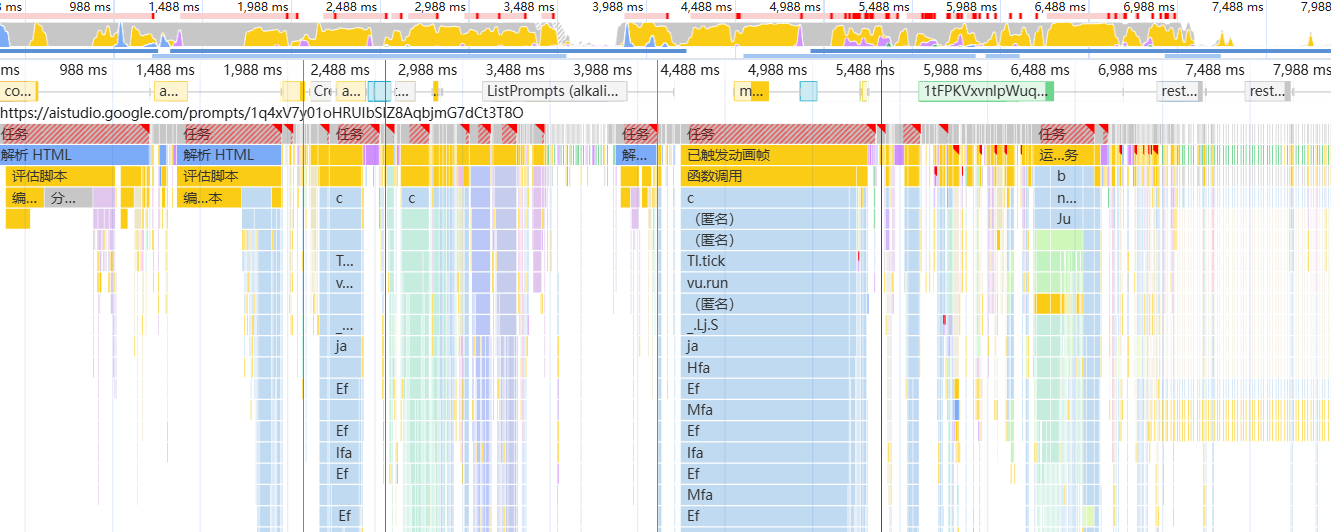
重点关注:长任务 (Long Task)
看到那些右上角带 红色小三角 的任务块了吗?
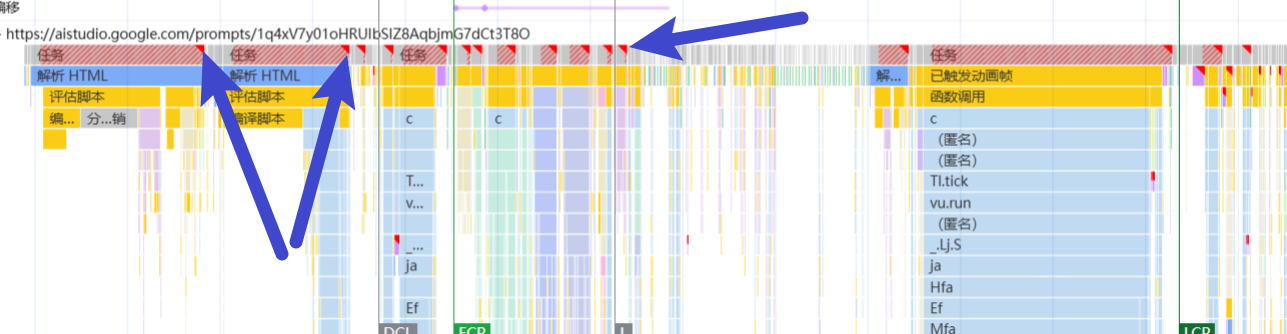
这代表一个 “长任务” (Long Task),即任何持续时间超过 50ms 的任务。浏览器主线程是单线程的,当它在执行一个长任务时,它就无法响应用户的任何操作(如点击、滚动),也无法进行渲染,页面就会卡住。
在截图中,充满了大量的黄色长任务,这是导致页面性能差的直接元凶!
解读
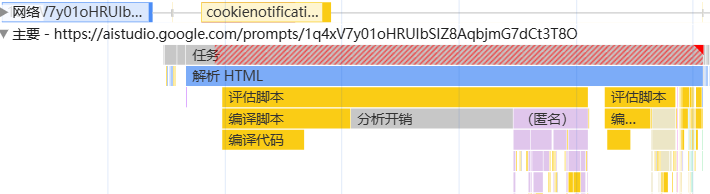
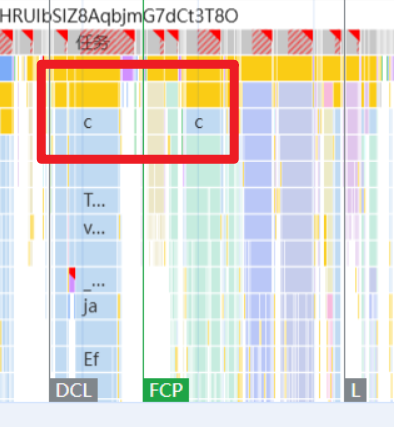
- 开始阶段(左侧):
- 浏览器开始 解析HTML (蓝色块)。
- 紧接着,它遇到了大量的 JavaScript,开始长时间地 评估脚本、编译脚本 (黄色块)。
中间阶段:
您可以看到一个非常宽的黄色块,代表一个持续了很长时间的 JS 任务。
我们放大看这个任务的 调用堆栈:最底下是一个匿名的任务,它调用了
c,c调用了(匿名),然后调用了Tl.tick,再调用了vu.run... 这一长串的堆叠,就是函数调用的路径。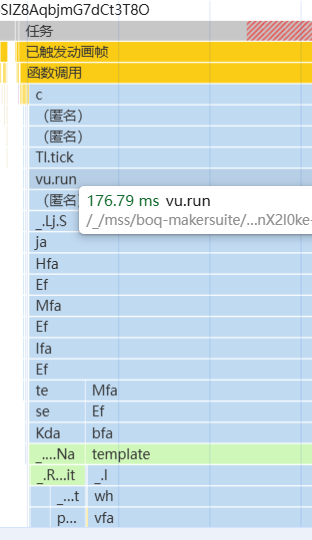
这说明,是一个或多个 JS 函数执行了太长时间,完全阻塞了主线程。
总结:整个页面的加载过程,被长时间的 JavaScript 执行反复打断和阻塞。浏览器想渲染页面,但总被 JS 拉去做别的事,导致 LCP 指标非常高。
3. 左侧 Insights & 底部摘要
左侧 Insights
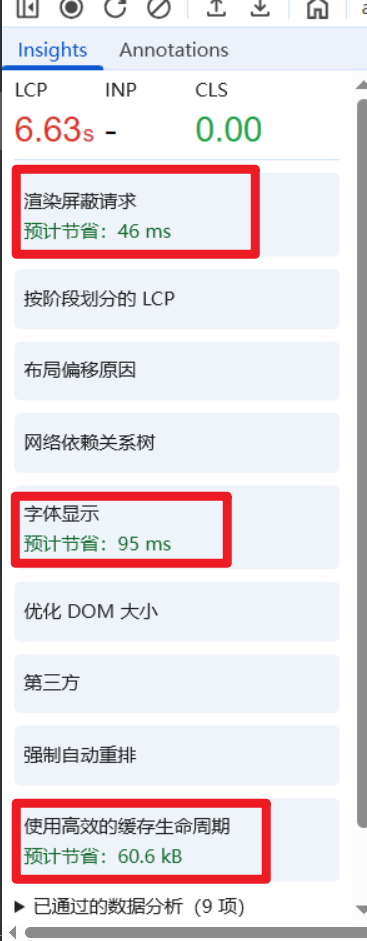
这是一个非常棒的新功能,它相当于 Chrome 的 AI 性能诊断医生。它会自动分析火焰图,并用更易懂的语言告诉你问题出在哪。
在截图中,它指出了几个问题:
- 渲染屏蔽请求 (Render-blocking request):有 JS 或 CSS 文件在关键时刻阻止了页面的渲染。
- 字体显示 (Font display):网页字体的加载策略可能可以优化,以更快地显示文本。
- 使用高效的缓存生命周期:一些资源没有被很好地缓存,导致每次访问都要重新下载。
该优先查看 Insights 给出的建议,它们通常直击要害。
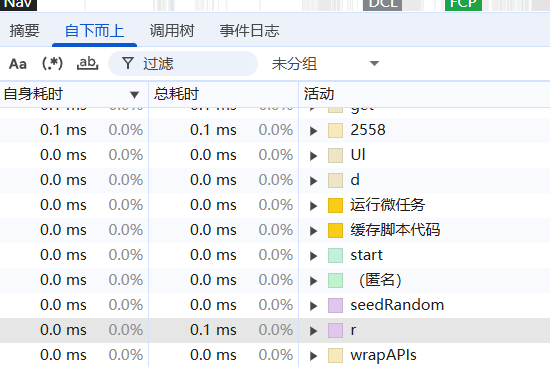
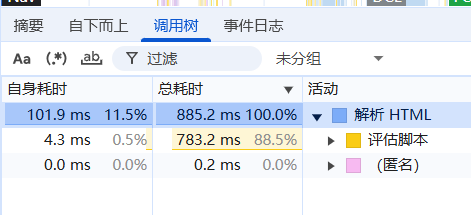
底部摘要 (Summary) 窗格:
当在火焰图中选中任意一个任务块时,底部会显示这个任务的详细信息。
摘要 (Summary):用饼图显示该任务中,各种活动(脚本、渲染等)的时间占比。
自下而上 (Bottom-Up):告诉你哪些底层函数耗时最长。这是非常有用的,它能直接定位到具体的最耗时的函数。
调用树 (Call Tree):按调用关系展示耗时。
三:诊断
这个网页患有严重的 “JavaScript 阻塞症”。
- 核心病因:主线程被多个长时间运行的 JavaScript 任务(那些带红色三角的宽黄色块)完全占据。
- 直接症状:导致 LCP 高达 6.63秒,用户需要等待很长时间才能看到页面主要内容,页面在加载过程中可能完全无法响应用户操作(卡死)。
- 并发症:Insights 面板还提示了渲染阻塞、字体和缓存等其他可以优化的问题。
下一步行动建议:
重点排查长任务:
- 点击那些最宽的黄色任务块。
- 切换到底部的 “自下而上 (Bottom-Up)” 选项卡。
- 查看列表中“总时间”最长的函数。这就是您需要优化的代码!
优化策略:
- 代码拆分 (Code Splitting):是不是加载了一个过于庞大的 JS 文件?考虑将非首屏必须的 JS 代码拆分出去,按需加载。
- 任务分解:对于那个必须执行的长任务,能否将其分解成多个小的、不超过 50ms 的任务?可以使用
setTimeout或requestIdleCallback等技术,将执行权交还给浏览器,让它有机会去渲染页面和响应用户。 - 算法优化:进入到耗时最长的函数内部,分析其逻辑,看看是否有可以优化的算法,比如减少循环次数、避免不必要的 DOM 操作等。